The human heart uses a series of rhythmic contractions to circulate blood through its four chambers.
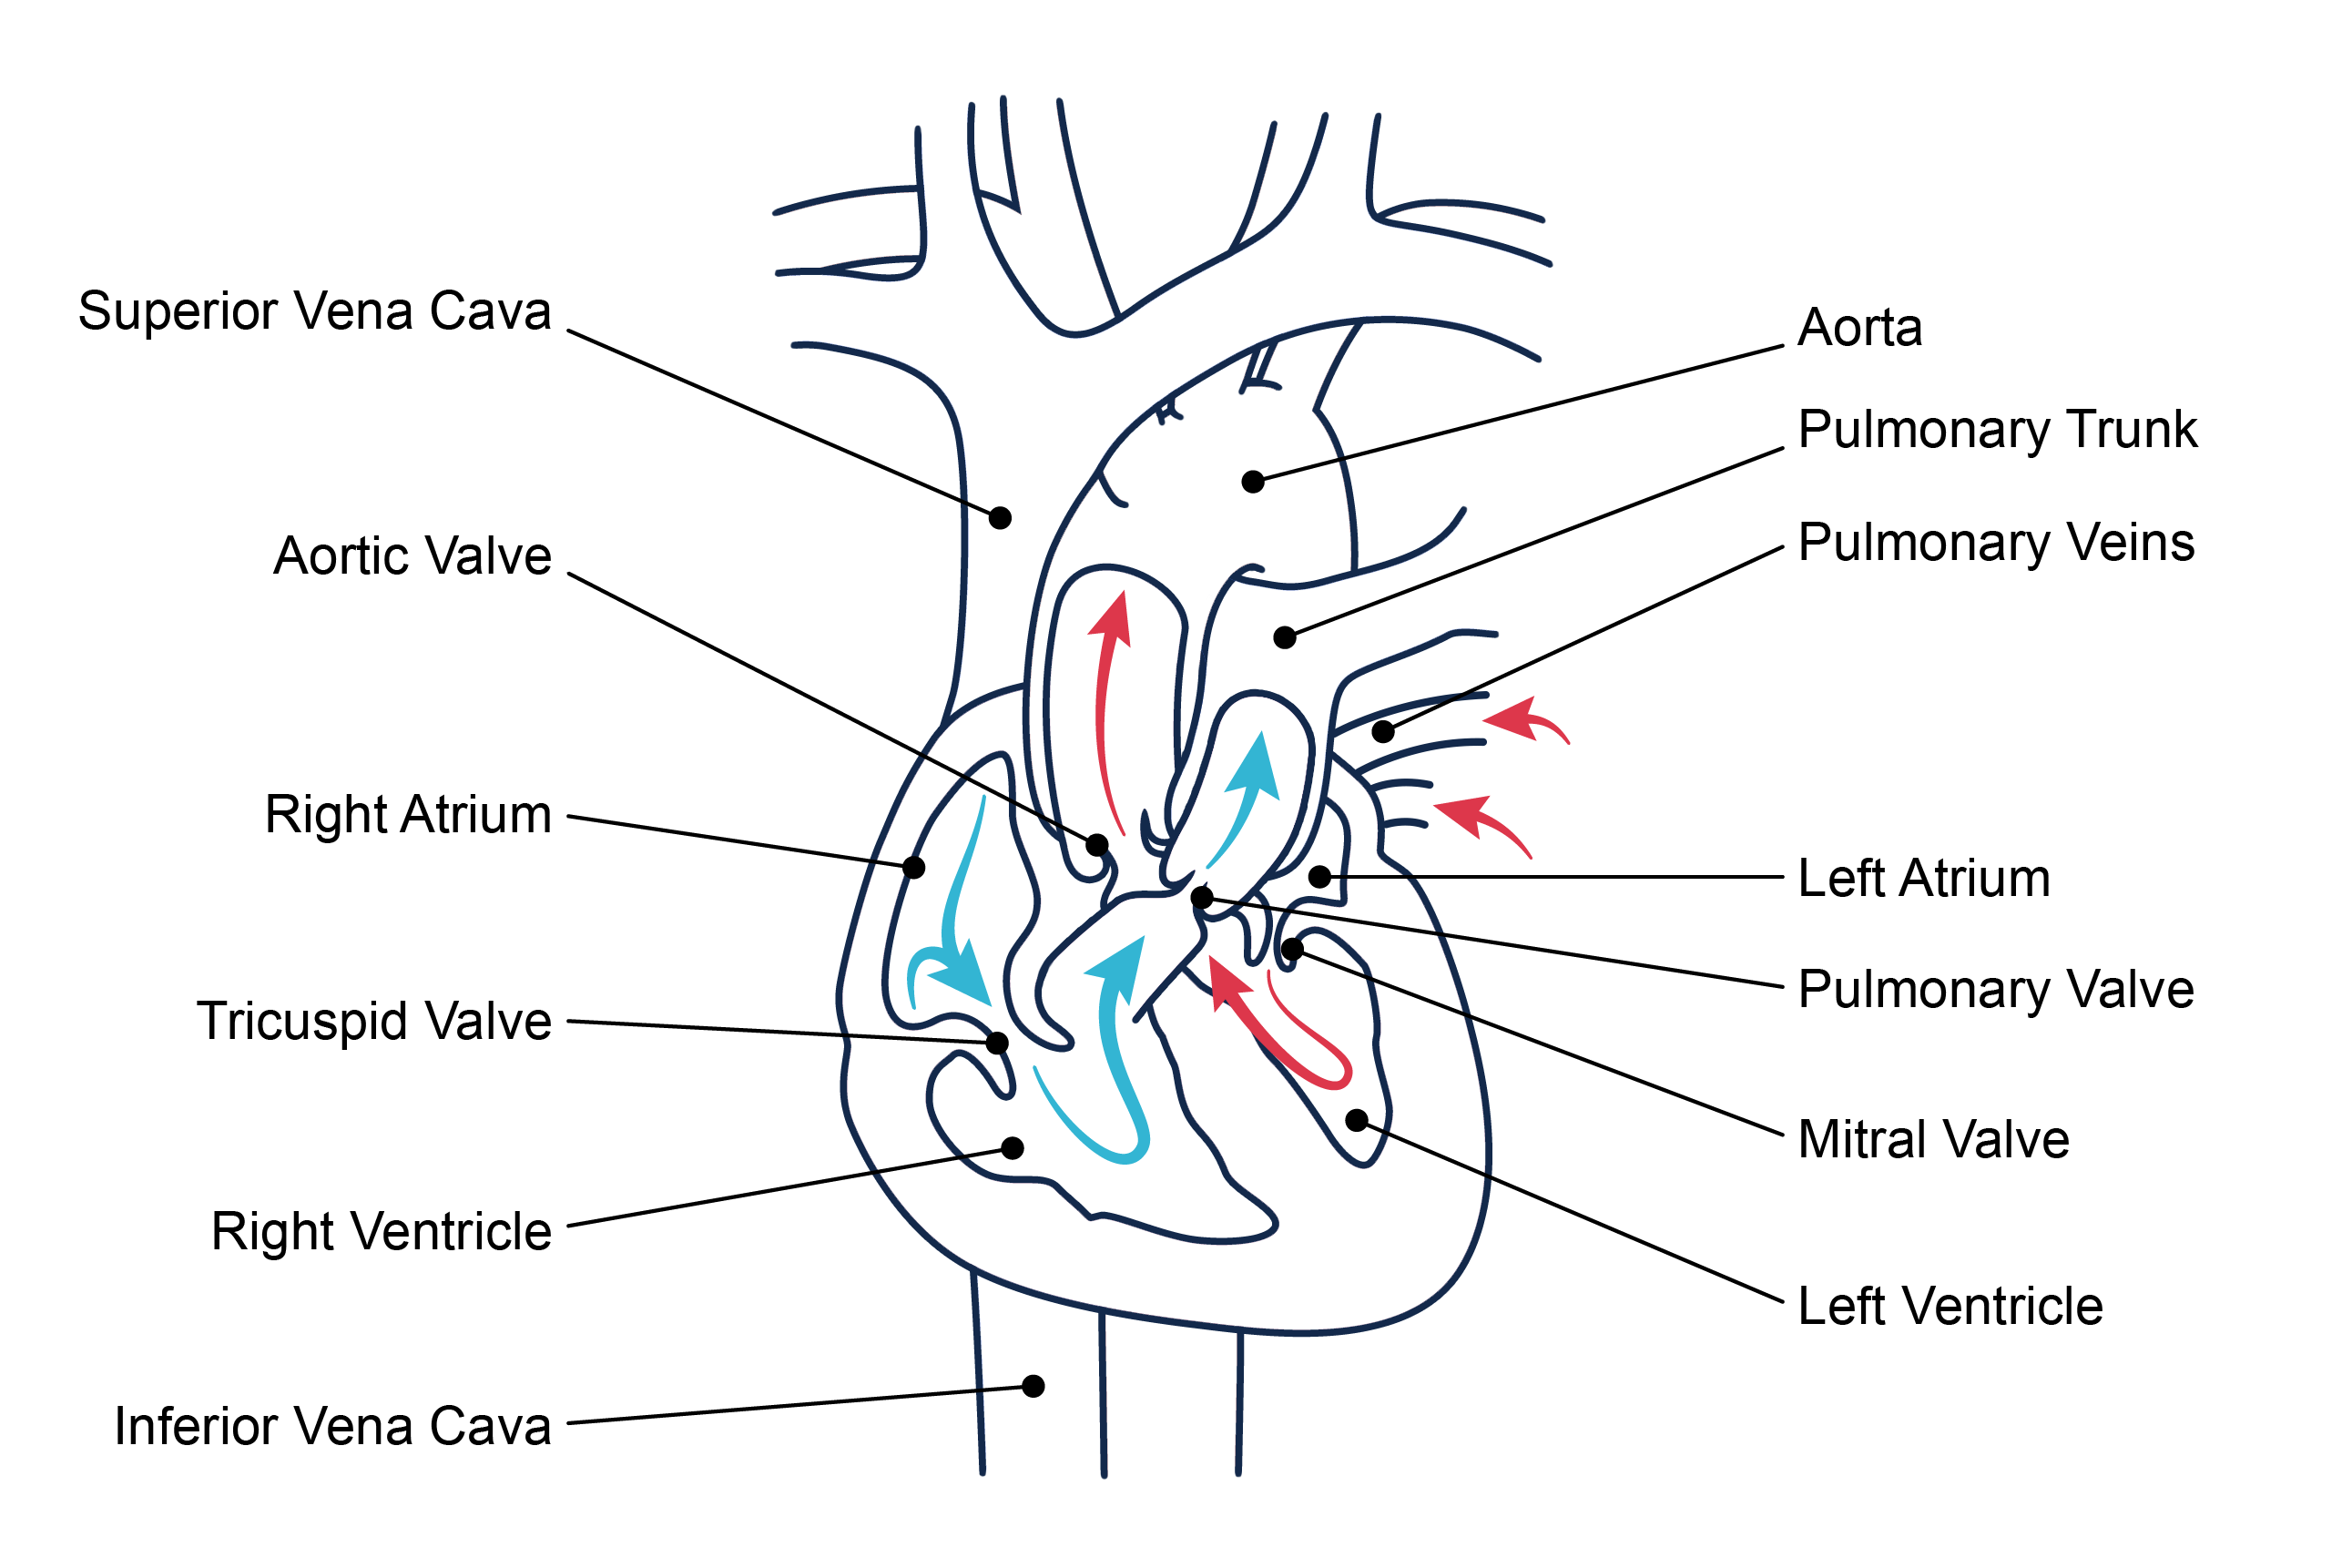
Unoxygenated blood flows from inferior and superior vena cava → right atrium → tricuspid valve → right ventricle → pulmonic valve → lungs → through pulmonary system
Oxygenated blood flows from the pulmonary veins → left atrium → mitral valve → left ventricle → aortic valve → systemic circulation
Cardiac Electrical Conduction System
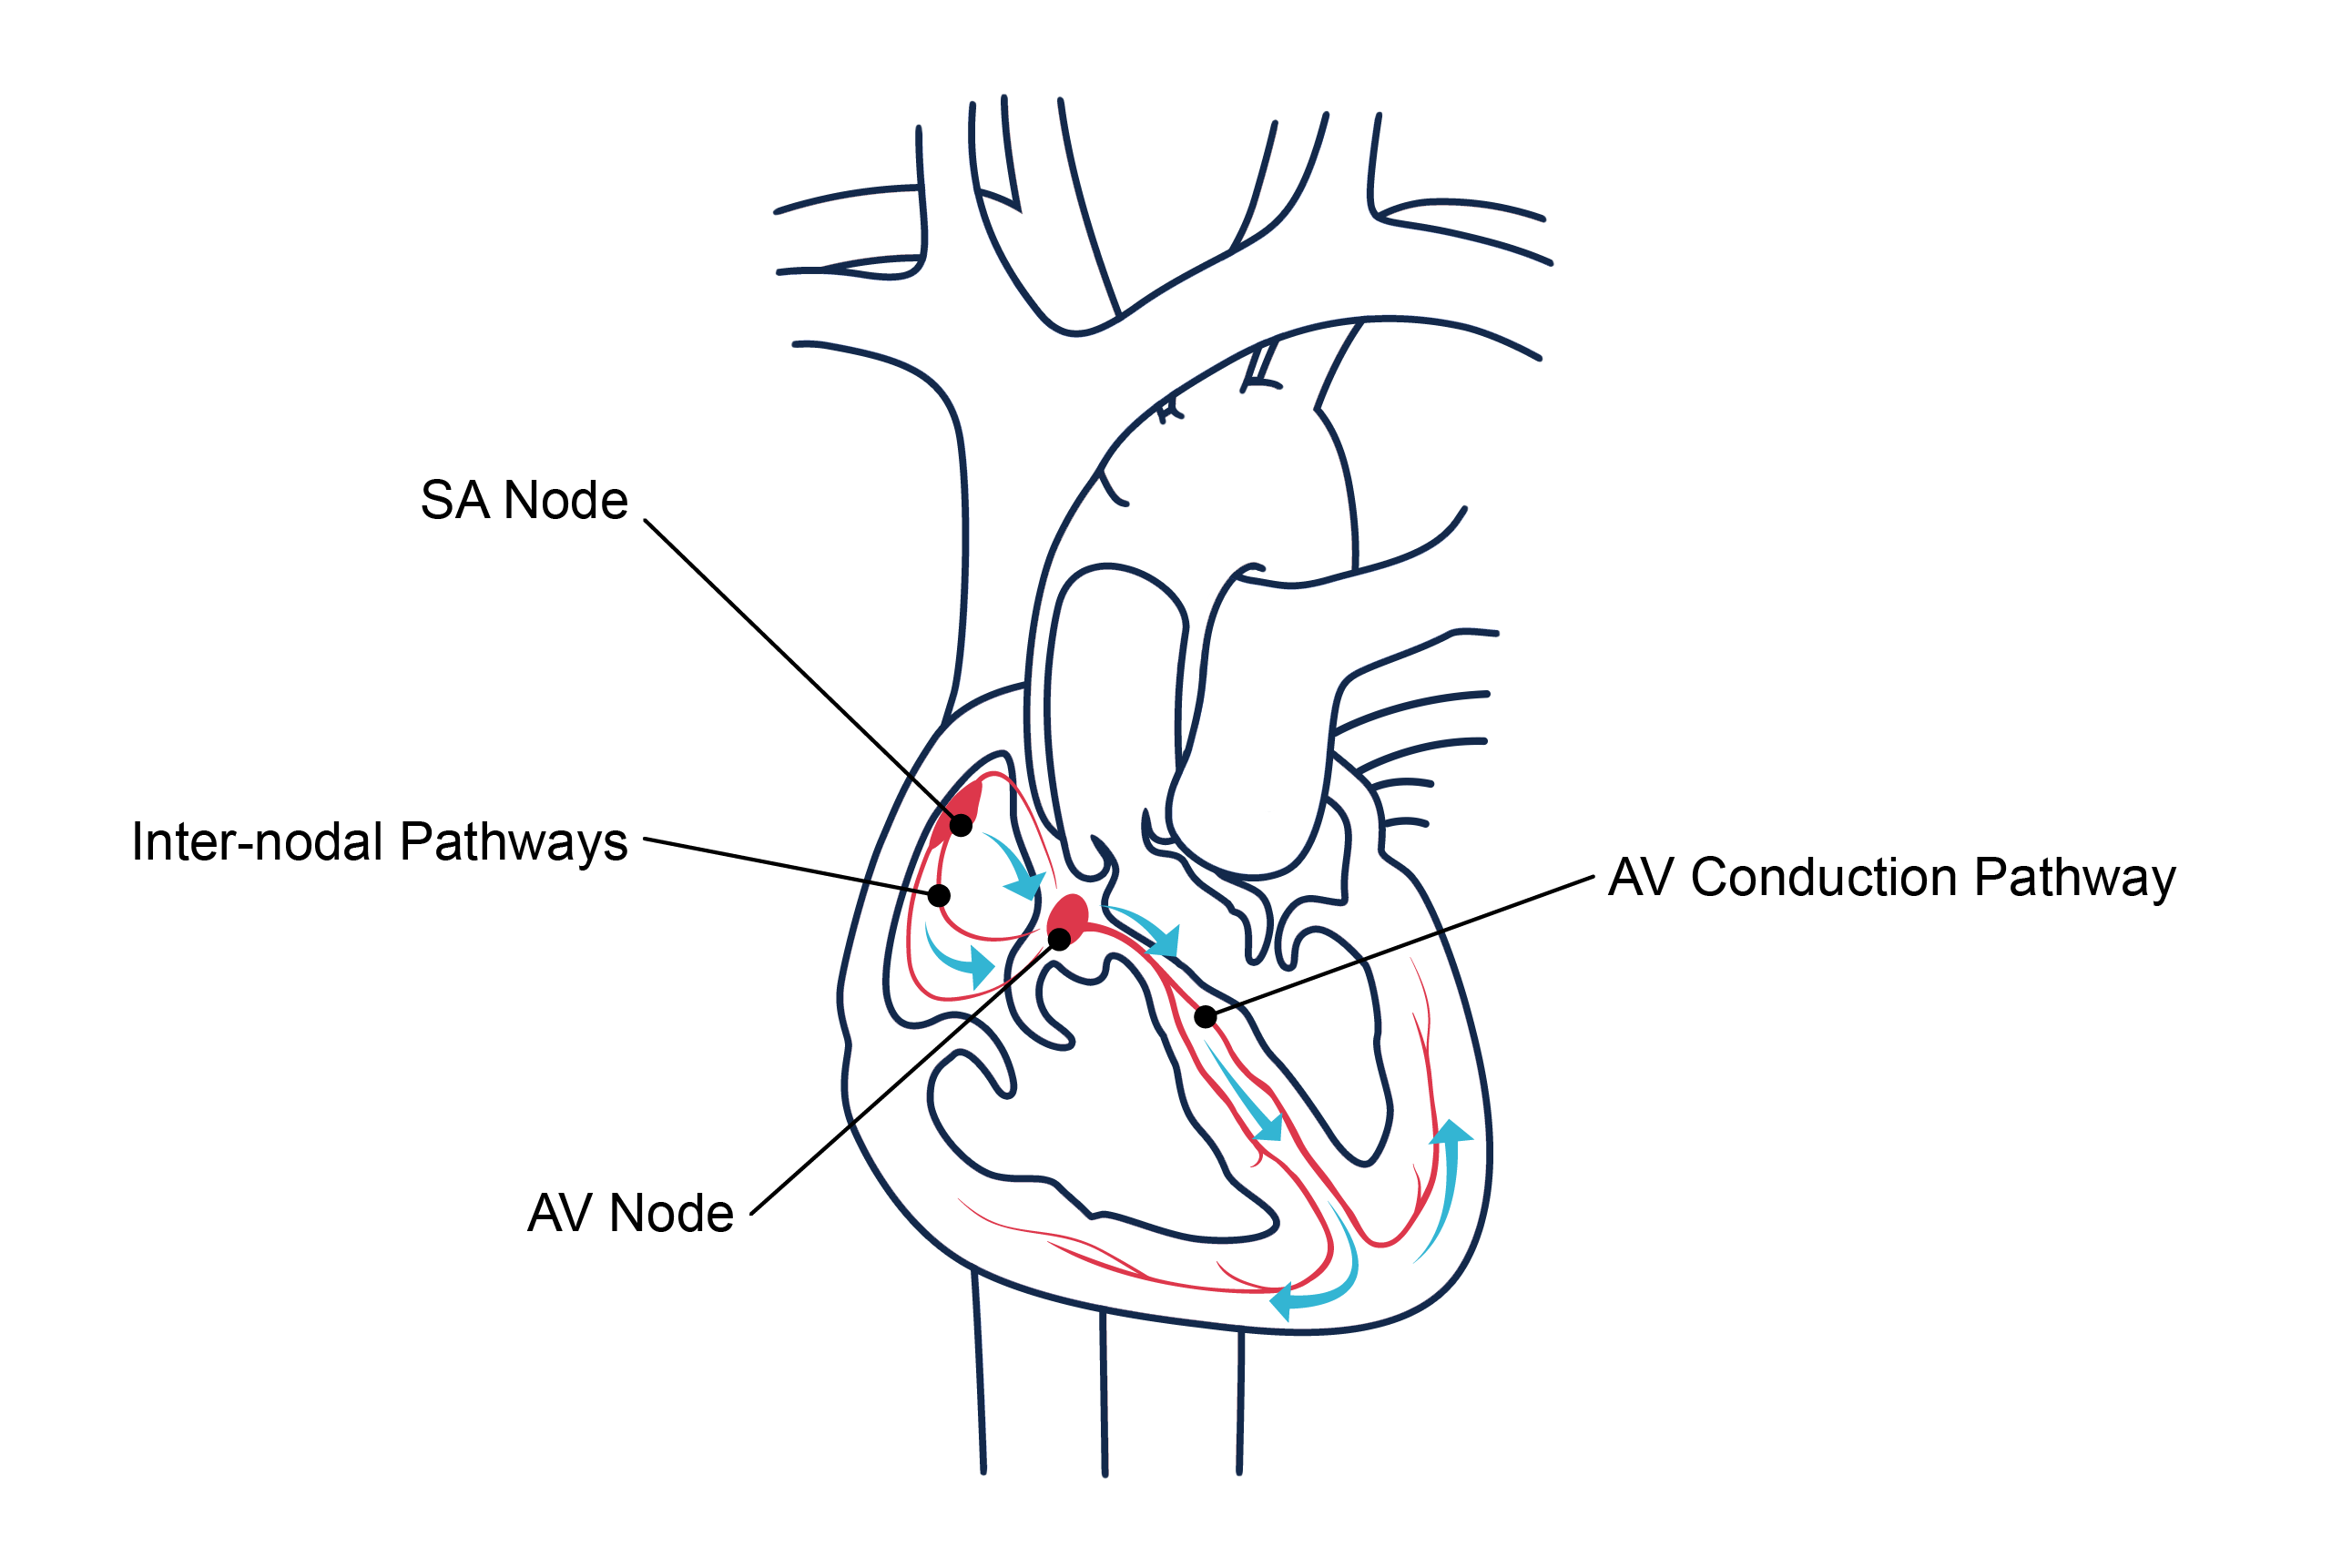
SA node - Stimulates atrial contractions and sets the pace for heart contractions.
Inter-nodal pathways - Communicate with AV node and atrial tissue to conduct the impulse.
AV node - Stimulates ventricular contractions.
AV conduction pathway - Spreads impulse through the ventricles. Consists of specialized cardiac muscle cells with nerve fibers: Bundle of His → left & right bundle branches → Purkinje fibers - spread impulse through the ventricles.
ECG Wave Form
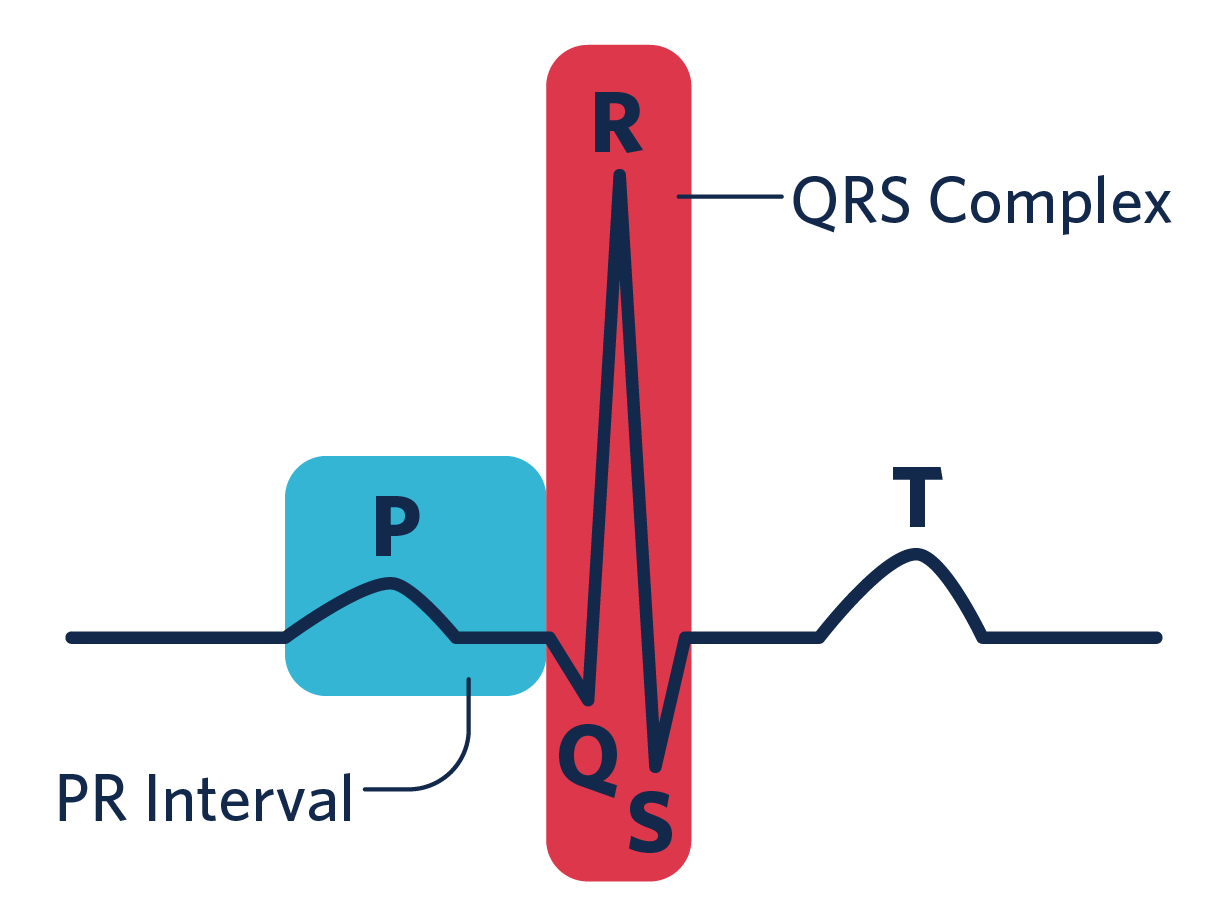
- One complete cardiac cycle = P, Q, R, S, (QRS complex), and T wave
- P wave = Atrial depolarization (contraction)
- QRS complex = Ventricular depolarization, atrial repolarization
- T wave = Ventricular repolarization (resting phase)
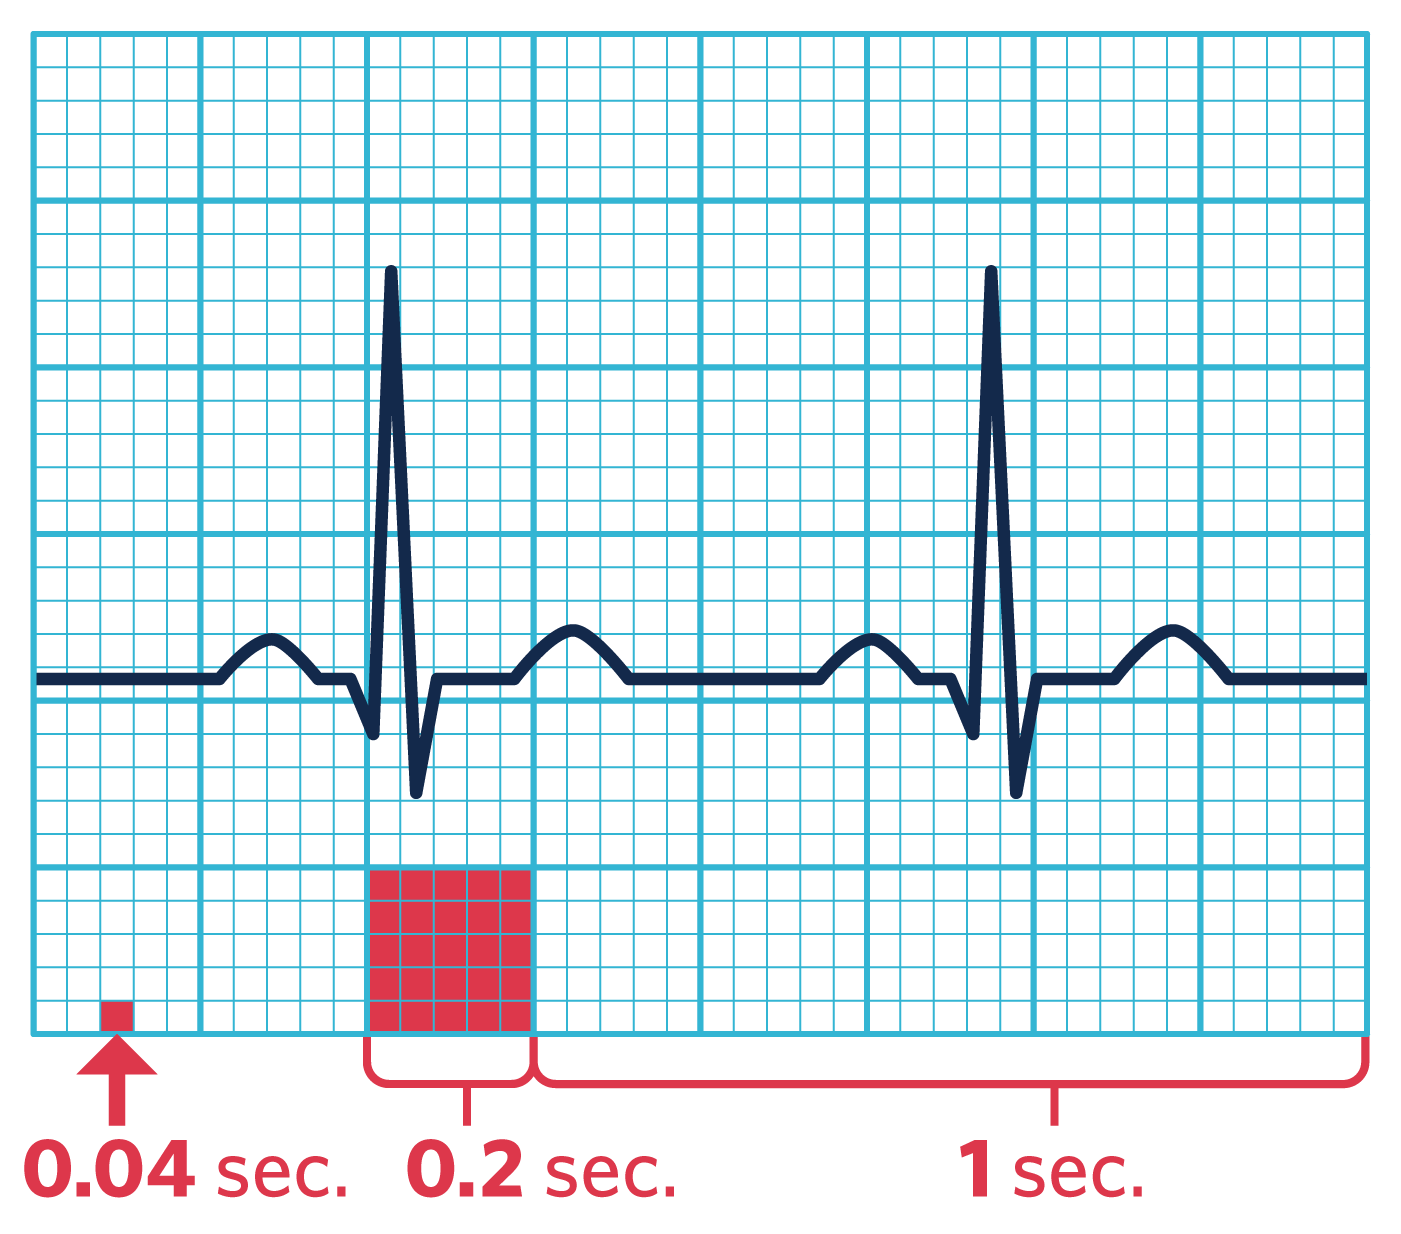
Each big square represents 0.2 seconds, and each small square represents 0.04 seconds.
A five-step approach, in order of application, includes analysis of the following:
- Heart rate
- Heart rhythm
- P wave
- PR interval
- QRS complex
Read strips from left to right. Each strip reflects six seconds of activity.
Heart rate
The speed of the heartbeat measured in beats per minute. Count the number of electrical impulses as represented by PQRST complexes conducted through the myocardium in 60 seconds (one minute).
- Atrial rate: Count the number of P waves
- Ventricular rate: Count the number of QRS complexes
Heart rhythm
A sequential beating of the heart as a result of the generation of electrical impulses. Classified as:
- Regular pattern: Interval between the R waves is regular
- Irregular pattern: Interval between the R waves is not regular
P wave
Five questions to ask:
- Are P waves present?
- Are P waves occurring regularly?
- Is there one P wave present for every QRS complex present?
- Are the P waves smooth, rounded, and upright in appearance, or are they inverted?
- Do all P waves look similar?
PR interval
Measures the time interval from the onset of atrial contraction to onset of ventricular contraction. Measured from onset of P wave to the onset of the QRS complex. Normal interval is 0.12–0.2 seconds (3-5 small squares).
QRS complex
Three questions to ask:
- Are the QRS complexes greater than 0.12 seconds (in width)?
- Are the QRS complexes less than 0.06 seconds (in width)?
- Are the QRS complexes similar in appearance across the ECG strip?
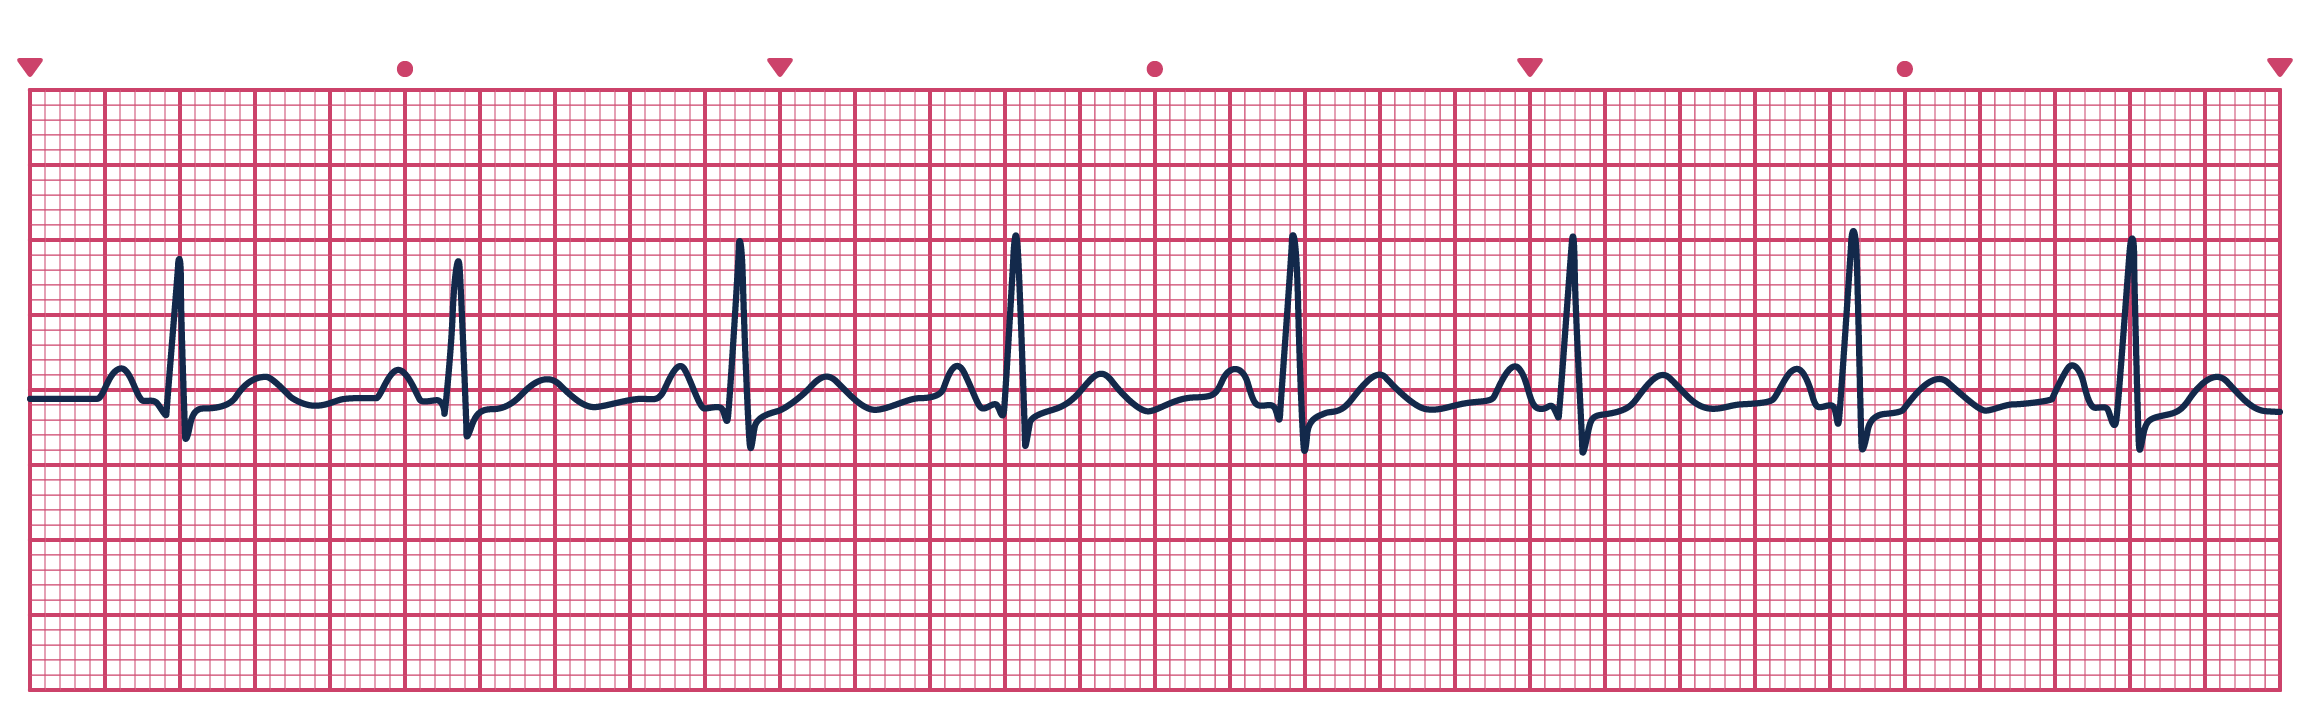
PRACTICE
Use the ECG strip provided to answer the following questions.
- HR = # of boxes between Rs = ?
- Rhythm = regular or irregular = ?
- P waves = P wave for every QRS?
- PR interval = measure from beginning of P to beginning of QRS = ?
- QRS = measure from start of Q to end of S = ?
Answers:
- 19 spaces = 79 bpm
- Regular (R-Rs are equal)
- Yes
- 0.16 (4 small boxes)
- 0.06 - 0.12 normally